How Gantt charts in project management help projects succeed

Backlog Staff
January 29, 2021
Most people are visual thinkers, which means most teams would benefit from communicating more project details in a way their members can understand. One of the most effective visual use cases is Gantt charts in project management.
A Gantt chart is a bar graph that maps a project’s course of action over time while visualizing accountability for each task. It is the visual backbone of any project, giving it structure from start to finish.
With a solid Gantt chart in place, you can keep everyone on track and communicate project changes quickly and effectively.
Benefits of Gantt charts in project management
Gantt charts visualize the timeline of a project plan with start dates, end dates, and checkpoints in between. Every project manager knows that tracking these key details is necessary to keep projects on schedule and within budget. Many don’t realize that people are more likely to understand and retain details they see over those they read or hear.
In fact, according to research from 3M, visuals are processed 60,000 times faster than text. This is probably why people will only retain 10% of what they hear, 20% of what they read, but a whopping 80% of what they see and do.
Before beginning any project, craft a Gantt chart with as much detail as possible. As new details take shape, add them in, so everyone has a visual overview of progress throughout. Refer to it often, and always communicate changes to our timeline visually.

Macro & micro views
Gantt charts in project management offer a unique perspective on projects with both macro and micro views. Together, these viewpoints are a powerful tool for time management.
In the macro view, you can see the project’s full scope and deadline. Your chart’s smaller details — including individual tasks and milestone deadlines — will make up the micro view.
A means to greater self-management
Paul Roughton from S&S Motorsports says the key to success is having good leadership without the claws of micromanagement. Gantt charts in project management give team members the context they need to self-manage. When run through the right project management tool, team members can directly notify any necessary stakeholders of any updates and status changes along the way. As a result, employees can feel simultaneously trusted and responsible for communicating their own updates.
For more formal updates, schedule check-ins right on your Gantt chart. Give each team member a chance to report on their successes and struggles and discuss how they’re approaching things moving forward. CEO of 10K Martijn van Tilburg recommends sticking to short updates from each team member to allow each person to focus only on the important details.
Easy to analyze & optimize
With color-coded milestones and clearly graphed-out details, you can understand a project with just a quick glance. If you are working on multiple projects simultaneously, Gantt charts make it easy to compare projects, plan resources, and discover opportunities for optimization.
Flexible & adaptable
As projects progress, unforeseen situations may require you to change your timeline. Luckily, Gantt charts make it easy to visualize any dependencies and effects of those changes. Moreover, their flexibility and ease of use make it easy to adapt to other work to accommodate the change.
Samit Shah, co-founder of EventEdge, suggests working additional time into your original Gantt chart to account for possible changes and give yourself a little leeway. You will be better prepared to still meet your project deadlines with extra time at your disposal.
Gantt charts as a roadmap
In addition to tracking projects and their progress, you can get a little more creative with your Gantt chart usage. When your project manager is planning out a new project or a new product release, chances are that they first will need to lay out all the individual tasks and assignments beforehand.
Once all of these tasks have been created and assigned with start dates and due dates, you’ll be able to see each milestone as an individual product or project roadmap in the Gantt chart view. Looking at a roadmap will help you and the whole team see what the project looks like in the bigger picture, including all the steps involved.
Gantt chart tools in project management
The beauty of Gantt charts in project management is that they come in all shapes and sizes. And you can make it as simple or as complicated as you need.
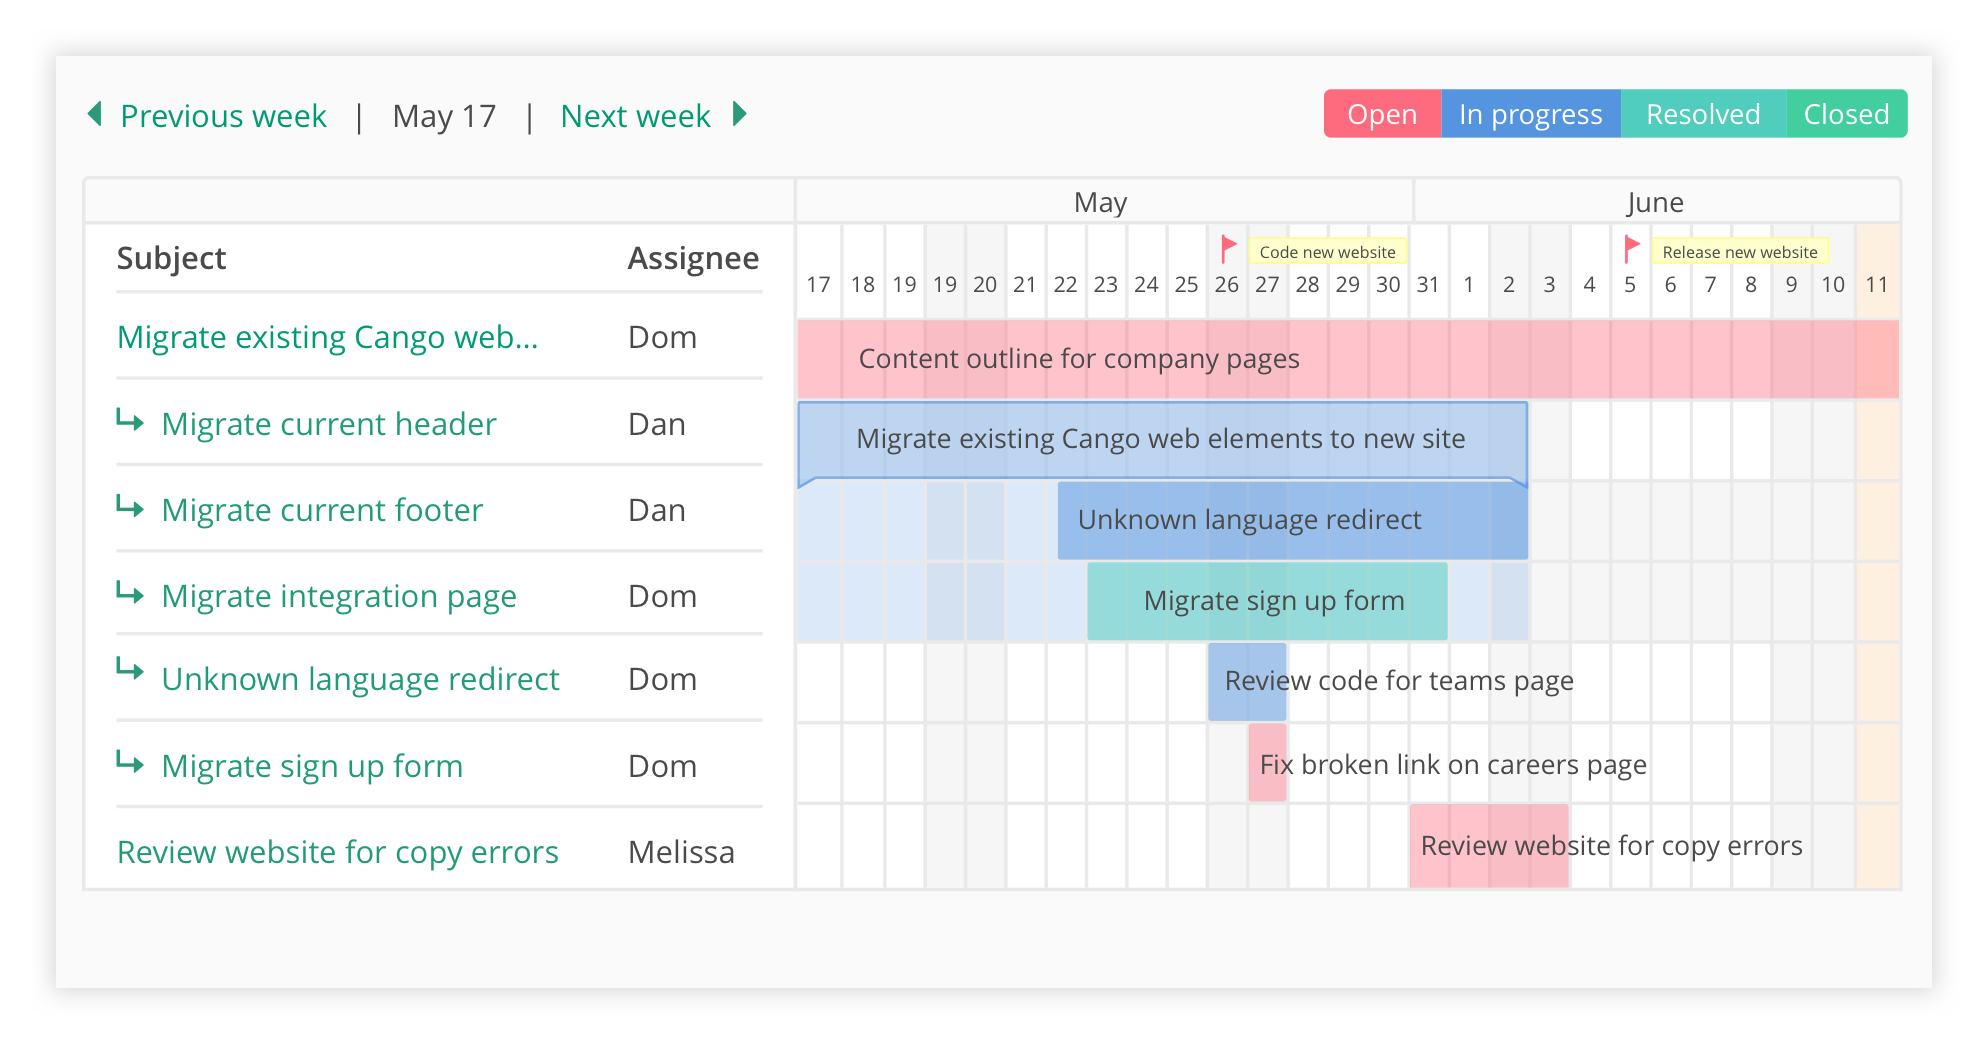
Nulab’s project management software, Backlog, automatically creates a Gantt chart for every project. These Gantt charts use color to show the status of an issue, providing immediate clarity on each task’s progress. Flags on the top bar indicate milestones.
Backlog also automatically generates Gantt charts for each user, graphing out every task assigned to each user in one simple visual. This gives each of your team members the advantage of using the power of Gantt charts in their personal workflow across projects.
With a Gantt chart as your project’s backbone, you have in your hands a powerful tool for success. Now all you need to do is figure out how you’re going to create and share yours.
This post was originally published on August 10, 2016, and updated most recently on January 29, 2021.

