Visualize work progress with Backlog’s story points and burndown charts

Backlog Staff
January 04, 2021
Backlog offers several ways to work visually with tasks. Besides Boards and Gantt charts, you can also use Burndown charts. Today, we’re going to give a quick overview of how you can use Burndown charts (and story points) to visualize how quickly you and your team are completing tasks and track if you are on target to hit your project milestones and deadlines.
Burndown charts vs Gantt charts
To refresh our memory, a Gantt chart shows each task as an elongated block with start and end dates on a continuous timeline.
On the other hand, a burndown chart shows the amount of remaining work (in hours) plotted against the milestone’s timeline. As work is done, a line ‘burns down’ until it reaches zero, which indicates that all work and tasks have been completed.
Comparing Gantt charts and Burndown charts
| Characteristics | Recommended uses | |
| Gantt chart |
|
|
| Burndown chart |
|
|
Gantt charts are intuitively easier to understand than burndown charts. That’s why some people prefer to use the Gantt chart for their projects. Additionally, it’s possible to manage or plan tasks on a Gantt chart and easily communicate details like the task status, person in charge, start/end dates, project deadlines, etc.
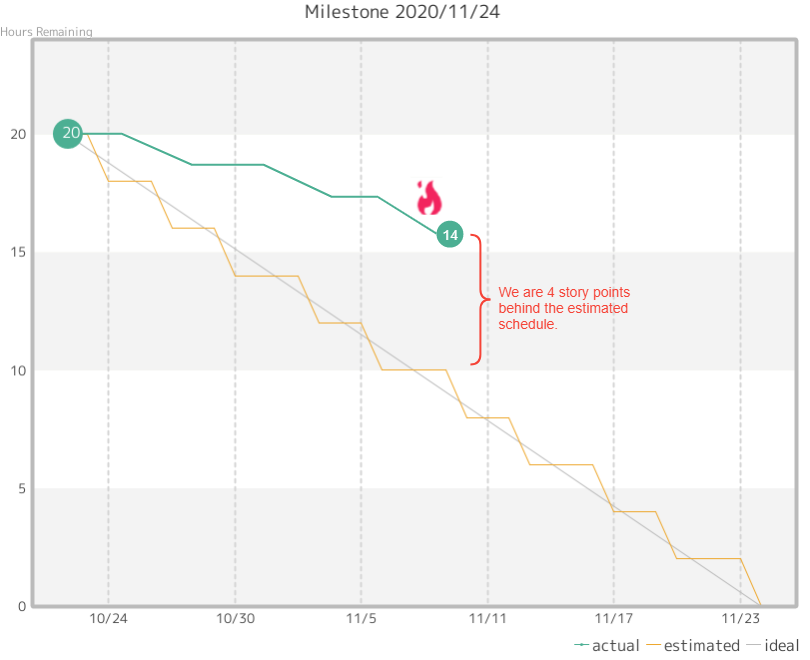
On the other hand, burndown charts are a bit less intuitive for people who are not familiar with them. But, they’re useful in helping us to understand the amount of work required and how long it’s taking to complete tasks. For example, it is possible to look at the burndown chart below and naturally come to the conclusion that it will be difficult to meet the milestone deadline based on the work rate.
Absolute vs relative estimates
Burndown charts operate on the principle of estimating how much work is required for tasks. To figure this out, there are two methods used for estimation:
- Absolute estimation is a direct estimation of the work/time required for a task, e.g. in units of hours, man-days, or man-months.
- Relative estimation is an estimation of the work and time of a task by comparing it to another task. The unit for relative estimation in Agile/Scrum is a story point.
Advantages of using relative estimation and story points
Firstly, it’s easier to agree on an estimate by using a common base for comparison.
For example, depending on the person, people tend to have differing opinions as to whether a task takes 5 or 8 man-days. Trying to settle the difference occupies the team’s time and blocks them from moving forward.
However, it’s easier to agree that Task A is about the same size as Task B and should take about the same amount of time. Thus, the team can advance to other parts of the planning or work.
Secondly, it’s easier to update quotes later if we use relative estimates.
Let’s say we worked on Task A, and it took 8 days instead of the planned 5 days. If we were using absolute estimates for our project tasks, we would need to readjust the estimates for the other tasks. For example, update Task B from 5 days to 8 days too, and so on for the rest of the other tasks. This will be quite tedious to do.
On the other hand, if we’re using relative estimates where both Task A and Task B are one story point each and Task A took 8 days (instead of 5), then it’s easier to conclude that Task B will also take 8 days. Recalculating the time/effort for the rest of the tasks will be simpler to carry out, and we can multiply the total story points by the new factor (8 days) to see if we can complete all tasks by the deadline.
Using relative estimates with burndown charts in Backlog
For Backlog’s burndown charts, there is an assumption that absolute estimates are used because each task or issue has an estimated hours input field. However, noting the advantages of relative estimates, we can use that by entering the number of points instead.

While using relative estimates or story points with your team, it would be good to discuss and decide a reasonable amount of time it would take to finish a one-point task. Then team members can set their expectations in advance, and the speed of their work is taken into account while planning the duration of the milestone or project.
For example, if we take one point: 2 days of work, then a total of 5 points would take 10 days.
Displaying this on the burndown chart might look like this:
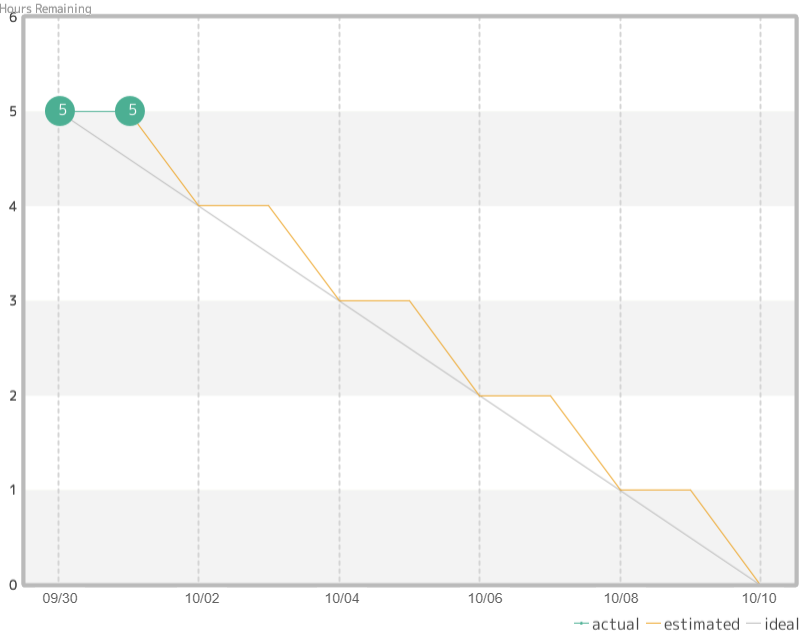
When a one-point task is completed in 2 days as expected, the burndown chart shows a corresponding decrease in points.

However, if Task A takes 4 days, which is more than expected (common in real-world projects), the burndown chart shows:
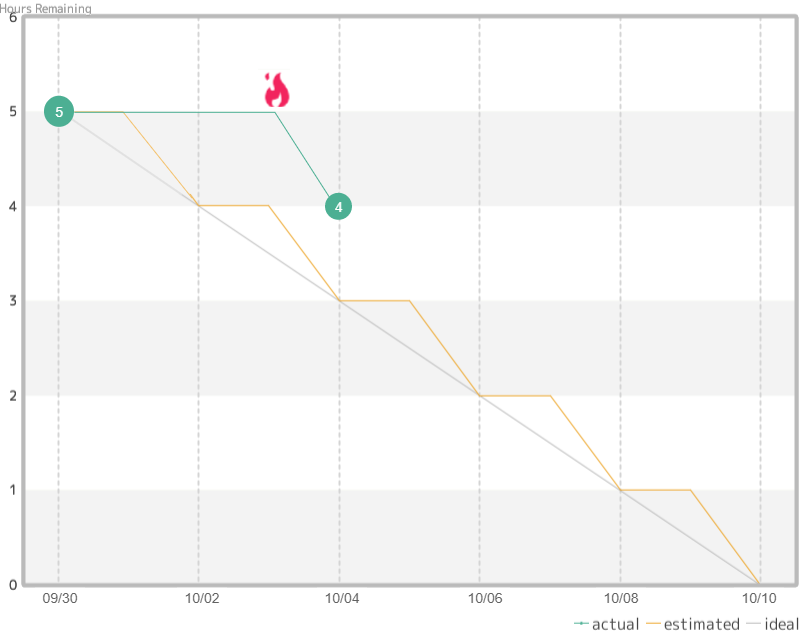
Faced with tasks taking a longer time than expected, it’s standard practice for the team to find ways to lessen the margin of error by extending the deadline or reducing the scope of the sprint.
If we were using relative estimates for tasks, we would not need to change the values for other tasks’ estimated hours. But if we were using absolute estimates and had entered the literal number of hours or days, we would face the problematic task of changing those numbers.
From this, we can see that relative estimates are more resistant to change. This is really another advantage of using relative estimates!
Using story points with Backlog
We’ve introduced how you can use relative estimates for burndown charts in Backlog and how burndown charts can help you monitor your progress on milestones.
In a real-world project, tasks may be completed faster due to various factors, like the team’s experience. However, even in that case, it’d be best to see the actual results on the burndown chart before incorporating faster turnarounds into your work schedule.
